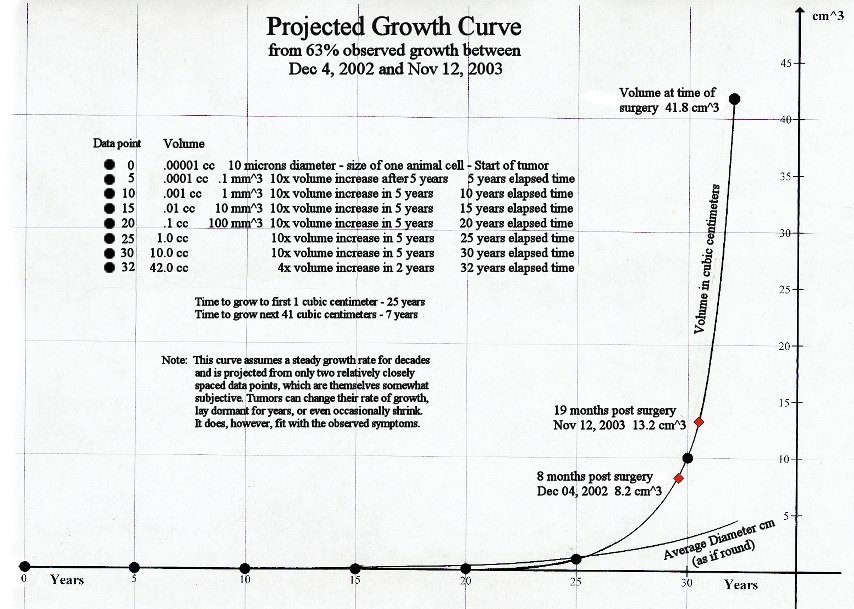
This graph was constructed from the size of the tumor, as calculated by the doctors, from the 8 month and 19 month MRI images. The 63% growth exhibited in that time frame indicates, if it were constant, a ten-fold increase in volume every five years, which is equvalent to a doubling every 18 months. That growth rate was extrapolated forward to the size of the tumor at the time of surgery, and back in time until the calculated size was equal to 10 microns diameter, the approximate size of one cell. The resultant estimate of the life of the tumor fits with the doctors' previous estimates of the inception of the tumor. |